
Effective Code Debugging: Top 8 Techniques
Debugging software is an important skill and we will explore some common strategies used to do this effectively.
In this guide, you’ll learn how to define your issue, interpret error messages for clues, use a debugger to gain better insights into what’s happening in the code, implement logging for clear indications of progress versus problems, localize said issues by isolating certain components or actions causing them, replicate scenarios using specific conditions that activate the problematic behavior.
You’ll then learn when to seek community feedback and forums for collaborative debugging, and test the system’s new updated state before completing improvements within the final step. With detailed explanations for our workflows covered in this exposition, you’ll soon become a well-acquainted problem-solver!
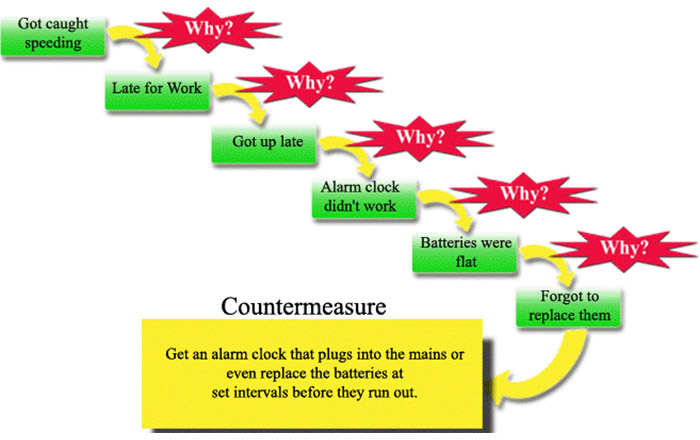
1. Define the Issue

Identifying the problem
Identifying the problem is a key step in successful debugging. In this portion of the process, it helps to define and articulate what the issue is: Describing symptoms experienced (eg. application crashing), misbehaving functionality observed (eg. incorrect output from a procedure), unexpected behavior reported (e.g failed API requests ), or any relevant information that is valuable for understanding the issue.
Gathering relevant information and context
Gathering relevant information and context lays the groundwork for successful debugging practices. Taking the time to fully understand your application’s codebase is invaluable.
Swot through recently committed code if applicable – newly written attributes or functions could be clues of relevance in addressing an issue at hand! Careful tracing of incorrect parameters passed to respective functions, as well as bad batches from the database, can work especially to help find where data originates and when it breaks apart.
2. Interpreting Error Messages
Analyzing error messages and stack traces
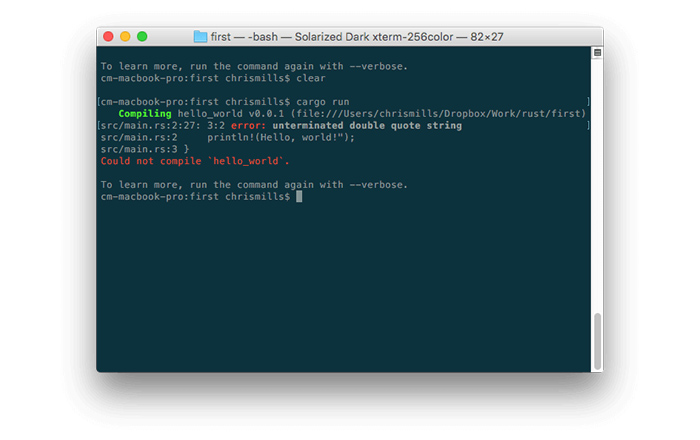
Error messages and stack traces provide valuable information about where an application or program has erroneous behavior. Analyze these carefully; the main goal in debugging is to try to understand why the program produced this message.
Investigate potentially relevant code, check invariants (expected results) as associated with particular lines of code giving insights into the source of the bug when jumping to conclusions about why.
Identifying the root cause of the error
Identifying the root cause of an error is one of the most important aspects of debugging. Error messages are generated based on various readings taken about a program previously, and allow us to interpret what actually happened inside the programs.
By using patterns found in these logs, variable values or snapshots of software states can be studied in order to identify inconsistency with how the program’s code instructs it to operate in a particular mode.
Using error message as a starting point for debugging
Using error messages as a starting point for debugging can be tremendously helpful. This strategy involves thoroughly reading the message, and analyzing each piece of criteria or keywords provided in terms of context and relation to program parameters. Basically, understanding what items have caused the malfunction before possible solutions are explored. Error messages prove that an issue has occurred.
3. Utilize a Debugger
Debugging tools and environments
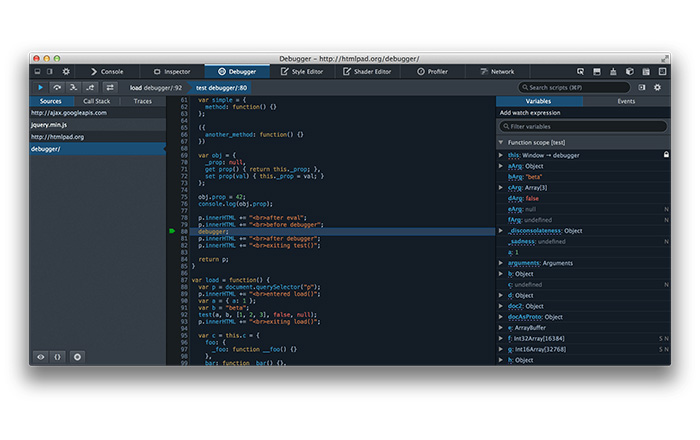
A debugger is a key tool used in the debugging process. It helps identify issues with code, by providing a dev environment in which users can step line by line through solutions manually to examine variables and their values via inspecting the stack trace. Progress can also be tracked over multiple segments of code resources be it source files or system libraries.
Users can use keyboard shortcuts or WinDbg commands chosen ahead of program launch to set breakpoints, continue execution, and so on. Debugging also allows web developers to identify general trends via data by undoing loops between successive counts in a compiled system thus potentially reducing the amount of wasted time spent creating code or identifying issues.
Setting breakpoints and stepping through code
When dealing with an unknown issue, setting breakpoints and stepping through code in a debugger is indispensable. A breakpoint freezes the current state of execution so critical lines may be inspected along with values for different variables used up to that point. This helps debuggers fully understand what data are being passed internally from various functions, improving thoroughly how we reach potential solutions sooner.
Analyzing program flow and identifying anomalies
Program flow analysis is an effective way to identify anomalies by visualizing program activities. When paired with a compatible debugger, one can step through the code on different processes and gain vital insights into its execution history, memory/variable addresses usage snapshots from each breakpoint, etc.
This setup digs more deeply into system behavior hence it becomes easier to find out at which point lacks synchronization resulted in disorderly code structures, or if improper reference has overlooked protective checks which render runtime errors.
4. Implement Logging
Importance of logging in code debugging
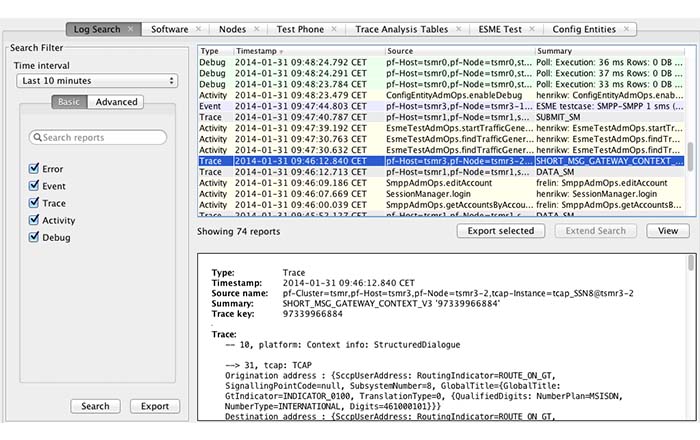
Logging is important in the debugging process as it can provide detailed information about a system’s status. It also keeps logs that trace back errors to their source by file, line of code, and even method level detail.
Further, developers often use configurable log levels– throughout the program to present traces at high granularities to those of diminishing detail. Knowing which messages are more critical and why they exist greatly assists the debugging process as there indicates potential broken implementation or some additional needs.
Inserting log statements in relevant code sections
Logging is an effective tool for troubleshooting code issues. To use it correctly, log statements should be inserted in areas of relevance – such as when a caller is creating the conditions or expected inputs.
The statement should include relevant data needed to debug the problem and accurately capture the functionality when executed without breaking the script syntax. Being proactive with good entry and exit information on functions allows for easier analysis of information. Utilizing different log levels helps lock down errors/annotations without over-resourcing significant errors.
5. Localize the Issue
Narrowing down the scope of the problem
Localizing the issue is important in any debugging process. Narrowing down the scope of the problem helps in pinpointing specific modules or components that could be causing an error and eliminates dead-end troubleshooting paths.
This can also help speed up the testing of solutions as input parameters become easier to manage. Techniques such as binary search or divide-and-conquer approach reduce diagnostic time as any intermediate suspected components can be immediately ruled out.
Isolating specific modules or components
Localizing an issue is essential to speedy and accurate debugging. Isolating specific modules or components helps to catch erroneous code more accurately, pin-pointing the origin of the bug with greater precision than utilizing generalized runtime errors or software log messages.
In some cases both targeted and standard error monitoring need to coexist in order for a reliable detection system should be implemented in order project-wide behavior. Tracking incoming requests, and executing modules or code paths thus can provide clear-cut performance issues should monitors locate overly influenced instantaneous events and be really valuable.
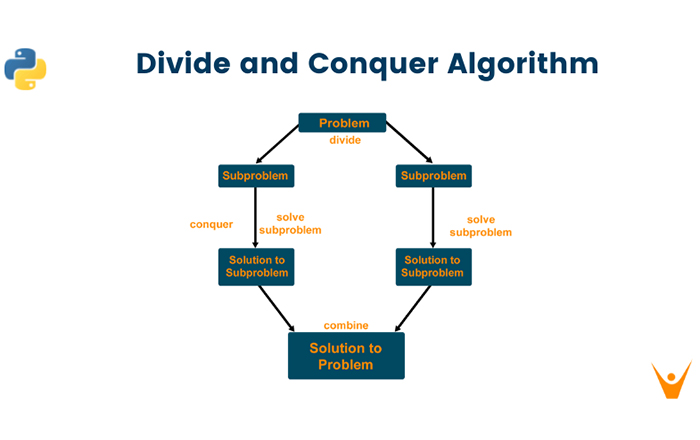
Using binary search or divide-and-conquer approach
The binary search or divide-and-conquer approach is a common strategy for localizing issues when debugging.
This cost-effective method requires analytic thinking and works by repeatedly splitting the focused scope in half –either analyzing the top and bottom portions of the source code sections, alternatively running different variations of possible test cases to quickly isolate undesirable results.
This method calls for thoroughness and accurate domain knowledge, allowing issues to quickly been pinpointed since disabling unwanted components is easier when modules already been insulated.
6. Replicate the Problem
Understanding the conditions that trigger the issue
When trying to replicate the problem, users should look at identifying the conditions that trigger it. What parts were in place when the issue occurred? Is there particular data being used or an unexpected synchronous process occurring?
In addition to tracing back user interactions and tasks, fully understanding any environmental aspects like version numbers of programs may be important too. The more related context identified, the more provided approach replicating the circumstances, only replicated root cause specifications begin.
7. Seek Community Support

Leveraging online forums, communities, or support channels
Seeking help from external communities when beginning to debug code can be highly beneficial. Support can come in various forms such as advice, suggestions, or people who have encountered a similar issue.
The best option is leveraging online forums, messaging platforms with specialized content related to programming issues, as well as topic-oriented social networks that offer structured methods of initiating conversations.
Identifying an appropriate support channel for relevant inquiries and technical issues is essential before presenting a prepared request with ample background information. Correctly formatting follow-up responses in posts is also advocated for competent community acknowledgment during problem-solving capabilities.
8. Test Again
Modifying and improving the code based on insights gained
Iterative debugging requires the review and refinement of our code based on the insights gained through each step. Once we’ve identified the underlying issue causing our software problem, it’s up to us to come up with a solution that accounts for what went wrong in the first place.
Modifying and improving the code can include making small adjustments, refactoring existing structures, or expanding how modules are organized. This process may introduce conflicting behaviors, though. Doing testing on each iteration ensures our changes have maintained the application’s expected behavior, and have met the desired result.
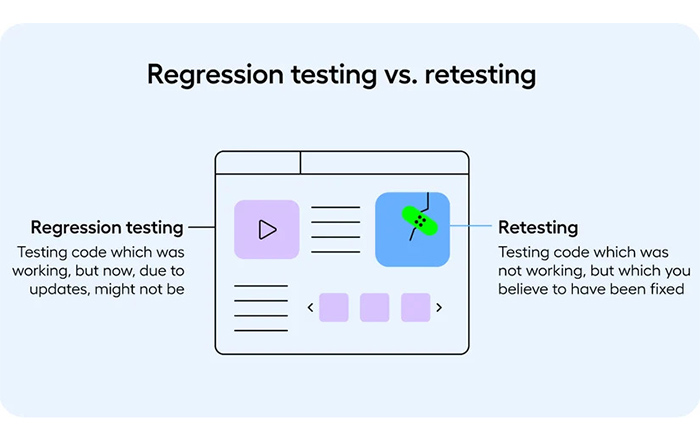
Performing regression tests to ensure overall system stability
Performing regression tests is an integral part of debugging processes in order to help ensure overall system stability. Regression testing involves rerunning the same tests and expected scenarios across certain sections that have been recently modified or revised during the debugging process.
Conclusion
Code debugging is an essential part of any development process, especially when working with complex systems. This outline provides a comprehensive look at some of the effective debugging techniques used to identify, investigate, and resolve errors stemming from code or other system dependencies. Continual practice of such intrinsic strategies helps one build confidence not just in successful solutions being achieved but also in sharpening expertise in this field.