
 AI ERP with agents inside the systems you run
 AI phone and voice agents for real calls
 LLM.coPrivate, self-hosted LLM deployments
 Legal AI infrastructure for firms
 AI RFP discovery and response drafting
 Automatic.coBusiness process automation
 CyberAttack.aiThreat detection and defense
 Secure AI virtual data rooms
 DigitalSign.coAI-designed digital signage for any screen
 cstm.aiCustom AI hardware, software, and engineers

Memory Usage: Detecting and Preventing Heap Fragmentation in Rust Applications
Rust gives you memory safety without a garbage collector, but it does not make memory usage free. A long-running Rust service can show steadily rising resident memory (RSS) even though nothing is leaking. Very often the cause is heap fragmentation: free memory that exists, but in pieces too small or too scattered for the allocator to reuse or return to the operating system.
This guide explains how heap allocation works in Rust, how to tell heap fragmentation apart from a real leak, which tools to measure it with, and the practical fixes, from choosing a different allocator to changing allocation patterns in your code.
Memory Management in Rust
Rust manages memory through ownership and borrowing. Every value has a single owner; when the owner goes out of scope, the value is dropped and any heap memory it holds is freed immediately. Borrowing lets other code use a value through references without taking ownership, and the compiler checks those references at compile time.
Because cleanup is deterministic, there are no garbage-collection pauses. But Rust itself does not manage the heap’s layout. Heap memory is handed out and taken back by an allocator, and by default that is the system allocator: glibc malloc on Linux, the platform allocator on macOS and Windows.
Stack vs. Heap: Differences and Trade-Offs
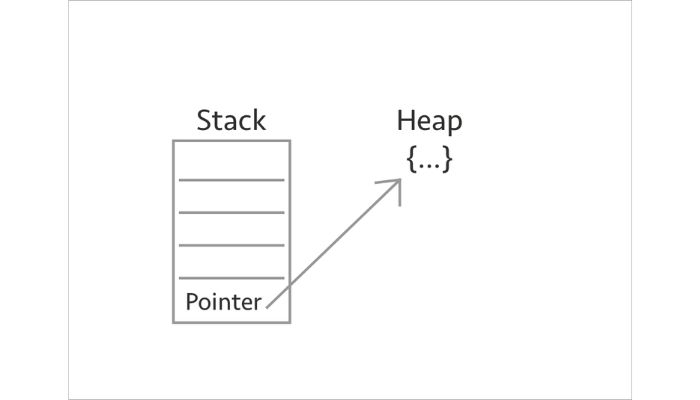
Stack memory is a contiguous region per thread. Allocating on it is just moving a pointer, it is freed automatically when a function returns, and it can never fragment. The catch is that sizes must be known at compile time and the stack is small, typically a few megabytes.
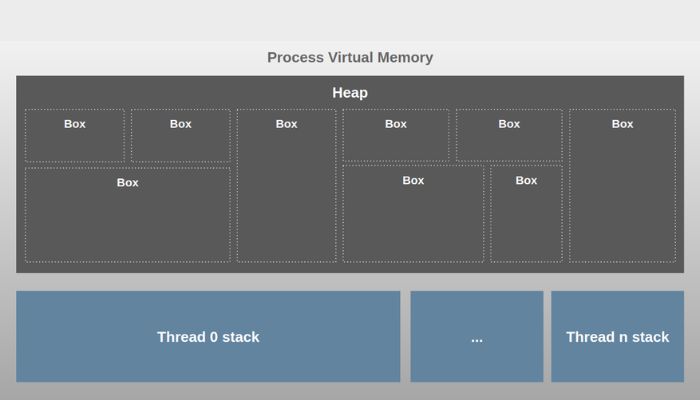
Heap memory holds anything dynamically sized or long-lived: Vec, String, HashMap, Box, Arc. It is flexible, but every allocation and free goes through the allocator, and that is where fragmentation happens.
How Heap Allocation Works in Rust
Rust code allocates through the GlobalAlloc trait. Collections call it whenever they grow: a Vec that runs out of capacity allocates a larger buffer (usually double), copies its contents, and frees the old one. When a value is dropped, its memory goes back to the allocator, not necessarily to the operating system.
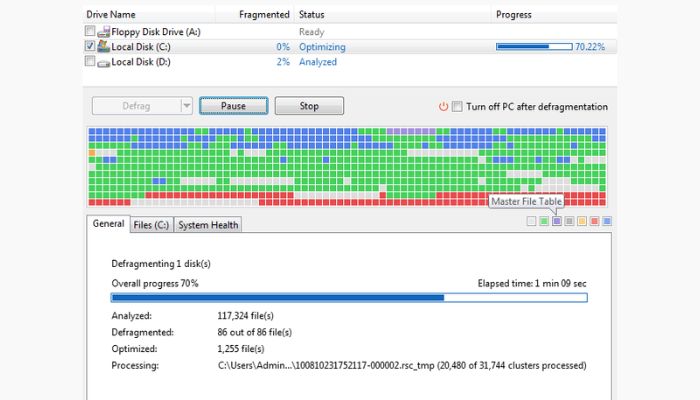
Fragmentation happens when the heap ends up with many small free gaps between live allocations. The total free space may be large, but a new request for a big block can’t fit in any single gap, so the allocator requests more memory from the OS. Meanwhile, the pages holding those gaps can’t be released because a few live objects still sit on them. The result is RSS that keeps growing even when your live data is flat.
Identifying Signs of Heap Fragmentation
Performance and Memory Indicators
- RSS grows over hours or days, then plateaus at a high level instead of tracking load. A true leak tends to grow without limit; fragmentation usually levels off.
- The gap between allocated and resident memory widens. If your allocator reports, say, 400 MB of live allocations while the process holds 1.5 GB resident, the difference is fragmentation and allocator overhead.
- Memory doesn’t come back after a traffic spike, even though request-scoped data has been dropped.
- Memory scales with thread count. glibc malloc creates multiple arenas for multi-threaded programs, and each can fragment independently.
Tools to Measure It
- jemalloc statistics: if you run jemalloc, its stats (via the
tikv-jemalloc-ctlcrate) reportallocated,active,resident, andretainedbytes. Comparingallocatedtoresidentis the most direct fragmentation signal you can get in production. - heaptrack and Valgrind Massif: record every allocation with a stack trace so you can see which code paths allocate the most and how long the memory lives.
- dhat-rs: a Rust crate for heap profiling in tests and benchmarks, useful for catching allocation-heavy code before it ships.
- bytehound: a memory profiler for Linux built for long-running processes.
- OS metrics: track RSS over time per process. Fragmentation is a slow-moving problem, so a dashboard over days beats a single snapshot. Profiling should be part of the normal software development lifecycle, not something done only after an incident.
Root Causes of Heap Fragmentation in Rust Applications
1. Mixed Lifetimes
The classic pattern is short-lived allocations interleaved with long-lived ones. A request handler allocates many temporary buffers, plus one object that goes into a long-lived cache. When the temporaries are freed, the cached object pins the surrounding page, leaving holes that are hard to reuse.
2. Growing and Shrinking Collections
Every time a Vec, String, or HashMap outgrows its capacity, it allocates a new, larger buffer and frees the old one. Repeated across many collections of different sizes, this leaves a trail of differently sized free blocks.
3. Many Small, Varied Allocations
Lots of small allocations of varying sizes (strings, boxed trait objects, nodes in linked structures) scatter across the heap. Each is cheap on its own, but together they make it hard for the allocator to keep large contiguous regions free.
4. Leaks That Look Like Fragmentation
Safe Rust can still leak: Rc or Arc reference cycles, Box::leak or mem::forget, and caches or maps that grow without eviction. Rule these out first with a heap profiler. If live allocations keep climbing, you have a leak, not fragmentation.
5. The Allocator Itself
glibc malloc is a general-purpose allocator and is known for holding on to fragmented memory in multi-threaded services. Many Rust projects see a large drop in steady-state RSS simply by switching allocators.
Strategies to Avoid Heap Fragmentation
1. Switch to jemalloc or mimalloc
This is usually the highest-impact, lowest-effort fix. Both allocators group allocations by size class, which limits fragmentation, and both return unused memory to the OS more readily than glibc malloc. Swapping the global allocator takes two lines:
// Cargo.toml: tikv-jemallocator = "0.6"
#[global_allocator]
static GLOBAL: tikv_jemallocator::Jemalloc = tikv_jemallocator::Jemalloc;
Benchmark with your real workload: the right choice depends on your allocation pattern, and the gains should show up in your RSS dashboards. If you must stay on glibc, the MALLOC_ARENA_MAX environment variable limits the number of arenas and often reduces fragmentation in heavily threaded programs.
2. Pre-Size and Reuse Collections
- Use
Vec::with_capacityandHashMap::with_capacitywhen you know the approximate size, so collections allocate once instead of growing repeatedly. - Reuse buffers in hot loops: call
.clear()on aVecorStringand refill it instead of allocating a new one each iteration.clear()keeps the capacity. - Call
shrink_to_fit()on long-lived collections after a one-off spike, so they don’t pin a large buffer forever.
3. Keep Small Data off the Heap
Crates like smallvec and arrayvec store small collections inline (on the stack or inside the parent struct) and only allocate when they outgrow that space. For short strings, crates such as smol_str or compact_str do the same.
4. Use Arenas and Pools for Same-Lifetime Data
When many objects are created and destroyed together, such as everything built for one request, one parse, or one frame, allocate them from an arena (bumpalo, typed-arena) and free the whole arena at once. Nothing fragments, because nothing is freed individually.
For objects of one type that are constantly created and destroyed, such as connections, buffers, or entities, a pool or slab (the slab crate, or a simple free list) reuses slots instead of returning memory to the allocator.
5. Separate Long-Lived Data
Allocate long-lived data, such as caches, configuration, and lookup tables, at startup where possible, and bound caches with an eviction policy. Keeping long-lived and short-lived allocations apart prevents a few persistent objects from pinning pages full of freed temporaries.
Conclusion
Heap fragmentation is one of the most common reasons a Rust service uses more memory than its live data justifies. The fix usually follows the same order: measure allocated versus resident memory, rule out leaks with a heap profiler, try jemalloc or mimalloc, and then reduce churn in your hottest allocation paths with pre-sizing, buffer reuse, arenas, and pools.
That discipline pays off most under real production load. See our guide to async Rust web servers with Actix for how far a lean, allocation-aware server can scale. If you’re deciding between Rust and its closest systems-programming rival, our C++ vs. Rust comparison digs into how each language handles memory safety and performance trade-offs.